
Overall and Local Sub-Area Housing Needs Supporting Paper
This is a HTML friendly version of the overall and local sub-area housing needs supporting paper.
Leeds Local Plan
Overall and Local Sub-Area Housing Needs Supporting Paper
Background
The Core Strategy was originally adopted in November 2014 and set a housing requirement of 70,000 (net) new dwellings in the period 2012 to 2028. The requirement led to the need for land allocations for 66,000 new homes, meaning the release of Green Belt sites was necessary at the time. In response, the Site Allocations Plan (SAP) proposed to release the largest level of land allocations for housing in the country.
The SAP was adopted in July 2019 and the housing target was then lowered in September 2019 by the adoption of the Core Strategy (2019), as the Core Strategy (2014) requirement was reviewed alongside the process of land allocations being made through SAP. At the same time, the Council had approved record levels of planning permissions boosted by the resurgence of the city centre market. The dual processes of the supply having been significantly boosted by SAP allocations and planning approvals alongside the requirement being lowered by the Core Strategy (2019) has meant that that the Council has been able to demonstrate a five-year housing land supply since 2019.
The SAP was then subject to a legal challenge and the Green Belt housing allocations in outer areas that contributed to the medium and long-term housing land supply were subsequently removed through the SAP Remittal process. The final SAP without the Green Belt releases for housing was adopted by the Council on 17th January 2024. The requirement figure for housing, which was the adopted as part of the Core Strategy in September 2019, was then in use for performance purposes until it was replaced upon becoming 5 years old on 11th September 2024. The requirement has now been replaced by a comparably higher figure set by the Government. The higher requirement has inevitably reduced the strength of the housing land supply in the short, medium, and long term.
The Council has made significant increases to the overall housing land supply in recent years with record numbers of approvals granted. However, the overall pipeline of supply is now disproportionately skewed to the City Centre and Main Urban Area with a large stock of approvals for flats and apartments. At the same time, the remaining opportunities in the outer areas have remained popular with developers providing traditional family homes often of 4 or more bedrooms.
The distribution of housing land supply in the city is now imbalanced with a reducing number of housing opportunities in the outer areas set against a substantial short-term supply of housing sites within the City Centre and a significantly reducing number of sites able to deliver in the medium and long term. The issue of matching the overall level of house building and its distribution to meet local housing needs is an approach that will be addressed through Leeds Local Plan (LLP).
Strategic Housing Market Assessment
The Council commissioned a new Strategic Housing Market Assessment (SHMA) with consultants arc4 and Edge Analytics in November 2022. The SHMA was published in September 2024 and updated in April 2025 to reflect changes to the National Planning Policy Framework (NPPF) in December 2024. The updated SHMA provides evidence of the housing needs of the district from the base date of the plan on 1st April 2024 and sets out a few headlines:
- the overall housing requirement to be set by the Government’s standard method
- an increasing need for affordable housing across the city
- a breakdown of housing mix (size and type of properties) needed in different areas
- recognition of research on current and future accommodation needs for students
- an increasing need for older persons housing particularly extra-care and independent living
- requirements for specialist housing for people with additional needs and specific household types
The evidence has revealed a disconnect between where housing supply is and where housing needs are. There is a now a need to deliver a more diverse range of dwelling types and sizes at appropriate densities to meet local needs. LLP is an opportunity to address and improve housing across the board with a planned approach that looks beyond overall numbers.
The policy position on housing at the national level can be clearly stated as one which has at its core the maximisation of supply, meeting specific needs, increasing affordability, diversifying housing options and contributing to economic growth. LLP has a wide-ranging scope to focus on type, size, quality and distribution of the right homes for everyone in Leeds in a way that is consistent with national policy.
National Planning Policy Framework (NPPF)
The NPPF provides the national policies for plan-making. It details key policies against which local plans will be examined and with which they must comply.
The requirement figure for housing was the adopted 2019 Core Strategy and, in accordance with the NPPF, was in use for performance purposes until it was either replaced as part of a local plan update with a new requirement or upon the adopted target becoming 5 years old on 11th September 2024. As the Core Strategy figure was not replaced by a new local plan it was replaced by the Government’s methodology for Local Housing Need (LHN) of 3,987 new homes per annum from the 2023 NPPF, which at the time included a 35% uplift for the 20 largest Cities and Urban Centres in England.
On 30th July 2024, the Government’s proposed reforms to the NPPF included an update to the ‘standard method’ taking an approach to increase existing stock and incorporate an uplift based an increased affordability multiplier. The changes also proposed to remove the requirement for an ‘urban uplift’, which applied to Leeds.
On 12th December 2024, the Government published the revised 2024 NPPF which sets a new Standard Method for assessing housing needs. The figure for Leeds was 3,811 new homes per annum. The figure is updated annually based on the latest Office for National Statistics (ONS) house price to work-place earnings ratio. On 24th March 2025, the updated ONS affordability ratio, which is calculated by dividing house prices by gross annual workplace-based earnings, saw the requirement change from 3,811 to 3,851 per annum.
On 22nd May 2025, the ONS then published the updated dwelling stock figures, which fixes the figures generated by the standard method until affordability ratios are next updated in March 2026. The minimum need for housing remained consistent and has increased minimally in every region except for London. In Leeds, the updated annual requirement is now 3,896 per annum.
Reasonable alternatives
Previous versions of the NPPF prior to the publication of the December 2024 version allowed local planning authorities to propose alternative housing needs figures as part of local plans. Up to 12th December 2024, the 2023 NPPF set out that the standard method for calculating housing need was an "advisory starting point" meaning it provided a baseline figure that local planning authorities should consider, but it was not mandatory in calculating housing requirements and could be adjust based on local factors and constraints, for example, the need to release Green Belt to meet full housing needs.
The 2024 NPPF §5 ‘Delivering a sufficient supply of homes’ now states that local plan strategic policies should be informed by a local housing need assessment, conducted using the standard method (LHN) in National Planning Practice Guidance (PPG). The PPG then sets out that the standard method should be used to assess housing needs unless there are some specific circumstances in which an alternative approach could be justified.
The specific circumstances in which an alternative approach could be considered are only where policy-making authority boundaries do not align with local authority boundaries, for example, in National Parks and the Broads Authority, or local authority areas where the sample areas are too small. This does not apply to Leeds and the LHN using the standard method is in use. Accordingly, all reasonable alternatives have been overtaken and superseded by the 2024 NPPF.
Nevertheless, in the past, the Council has consulted on a wide range of housing need options and whilst national guidance and the Council’s local evidence suggest a clear LHN target of 3,851 homes per annum it is considered appropriate to ask the question of consultees about a higher or a lower LHN target and to explore whether there is evidence to suggest an alternative.
Annual housing requirement
The Government has determined that, to meet local needs and help address the housing crisis that is being experienced across the country the supply of homes needs to be significantly boosted. It calculates that for Leeds at least 3,896 new homes need to be built each year. This figure accords with the local evidence that the Council has gathered through its SHMA, which included a household questionnaire of residents and a stakeholder survey.
The plan period
The LLP plan period is 1st April 2024 to 31st March 2042.
Total plan requirement
Plan | Period | Requirement |
2019 CS | 1st April 2024 up to 11th September 2024 | 3,247 per annum |
2023 NPPF | 11th September 2024 to 12th December 2024 | 3,987 per annum |
2024 NPPF (2024 LHN) | From 12th December 2024 | 3,811 per annum |
2024 NPP (2025 LHN) | From 1st April 2025 | 3,896 per annum |
In 2024/25 the annual requirement is split between the three plans with the 2019 CS in place until 11th September upon which the 2023 NPPF is in place at 3,987 per annum then replaced from 12th December 2024 by the 2024 NPPF at 3,811 per annum. The blended requirement for the year 2024/25 is 3,602.
Plan | Per annum | 2024/25 days | Requirement |
2019 CS | 3,247 | 164 | 1,459 |
2023 NPPF | 3,987 | 92 | 1,005 |
2024 NPPF | 3,811 | 109 | 1,138 |
2024/25 annual requirement | 365 | 3,602 | |
The total plan requirement from 2024/25 to 2041/42 comprises 1 year of the 2024/25 split requirement between the 2019 CS, the 2023 NPPF and 2024 NPPF, then the remaining 17 years of the 2024 NPPF annual requirement.
Period | Years | Requirement |
2024/25 (2019 CS, 2023 NPPF & 2024 NPPF) | 1 | 3,602 per annum |
2025/26 to 2041/41 (2024 NPPF) | 17 | 3,896 per annum |
Total | 18 | 69,834 dwellings |
The total requirement is a minimum of 69,069 new homes over the 18-year plan period.
Land allocations to meet need
Land allocations will be required to meet total housing needs. However, not all the land needed to meet the LHN target will need to be newly allocated as part of LLP. The Council’s housing land supply evidence base reveals that there is current supply on sites that have been completed since 2022, sites with extant planning permission, existing allocations and anticipated as windfall (i.e. not identified but evidence to suggest will arise) through the plan period that can contribute.
LLP will need to ensure that the stock of land that it relies on to deliver its LHN is developable, deliverable, available and achievable through the plan period. Part of that will involve considering that long standing site allocations that have not come forward for housing in the past may not meet these characteristics and need to be discounted from the calculations.
Meeting a LHN target requires more land to be identified than is sought to meet local needs. The Council knows through monitoring that developers require a wide range of sites available at any given time and more land available than will be ultimately delivered at any one time. Therefore, it is proposed that a 10% buffer is added to the LHN to guide the identification and allocation of sites (i.e. land for 75,976). This approach also helps support the maintenance of a 5-year housing land supply which is a key requirement of the NPPF and significantly reduces the likelihood that speculative development will occur through the plan period.
A 10% buffer provided to the overall housing need ensures that the minimum housing need figure is met in full. The 10% buffer provides some headroom to account for non-implementation or build out rates that stretch beyond the plan period which enables the plan to have flexibility and security in the maintenance of the housing land supply across the short, medium, and long term. The buffer would also provide justification to applying a windfall allowance providing security to the land supply if forecasted windfall does not come forward at the rate envisaged.
A 10% buffer is a positive feature of plan-making because it increases the capacity of the plan to respond to unforeseen circumstances and the inherent uncertainty of events (such as the housing industry’s response to the pandemic, cost-of-living crisis, interest rate instability and national policy changes) and helps ensure that the plan requirement is met by establishing more housing land supply than is required as a minimum. This is also in line with the NPPF as the requirement is not expressed as a maximum and national guidance which requires that plans are deliverable.
The total requirement including a 10% buffer is 76,817 new homes over the 18-year plan period.
Deliverable housing land supply
The NPPF notes at Paragraph 36 that plans must be effective including being deliverable over the plan period. For housing in particular Paragraph 72 sets out that Plans should identify a supply of specific, deliverable sites for years 1 to 5 of the plan period and specific, developable sites or broad locations for growth, for years 6-10 and, where possible, for years 11-15 of the plan.
The NPPF Annex 2: Glossary defines deliverable as follows:-
Deliverable: To be considered deliverable, sites for housing should be available now, offer a suitable location for development now, and be achievable with a realistic prospect that housing will be delivered on the site within five years. In particular:
a) sites which do not involve major development and have planning permission, and all sites with detailed planning permission, should be considered deliverable until permission expires, unless there is clear evidence that homes will not be delivered within five years (for example because they are no longer viable, there is no longer a demand for the type of units or sites have long term phasing plans).
b) where a site has outline planning permission for major development, has been allocated in a development plan, has a grant of permission in principle, or is identified on a brownfield register, it should only be considered deliverable where there is clear evidence that housing completions will begin on site within five years.
The NPPF defines developable as follows:-
Developable: To be considered developable, sites should be in a suitable location for housing development with a reasonable prospect that they will be available and could be viably developed at the point envisaged.
LLP will make use of all existing deliverable and developable supply that remains available for development within the plan period. This will maximise the existing potential of the current planning permissions and remaining land allocations whilst fully realising the contribution of supply, which continues within the city centre with a large stock of sites with extant planning permission remaining.
The direction of housing land supply towards the city centre and main urban area was characteristic of the SAP and was a sound approach endorsed by the SAP Inspector. This form of supply continues to meet needs in the most sustainable locations and is in line with the inclusive growth strategy objectives of locating homes close to jobs, especially in the priority areas and aligned with programmes for city centre growth such as the South Bank. It is considered that where supply remains deliverable that it is supportive of the Council’s objectives to make best use of brownfield land close to jobs and services.
The effect of using all existing deliverable supply means that locations, particular outer areas and smaller settlements, that have not recently delivered new homes and do not currently have stocks of planning permissions will not need to make as many new land allocations that their full housing needs would necessitate. This is because the need to find new sites in those locations has been reduced by the existing land supply due to a large surplus of land supply in the city centre which is re-distributed in the calculation of land allocations needed against needs across the district.
Historic housing land supply and delivery
The Authority Monitoring Report (AMR) sets out performance of housing land supply and delivery since 2017. A net total of 4,441 dwellings were completed in 2023/24, exceeding 2019 CS targets by 1,194 units. This was up 64% from the previous year. A total of 3,422 of new dwellings were delivered on brownfield land in 2023/24, representing 79% of all housing, up by 18% from the previous year and exceeding the target of 55%.
Net housing completions over Plan Period; 2017-24 | ||||||||
Year | Core Strategy Policy SP6 | Type | Losses to demolition | Total | Delivery against target | |||
New and net converted units | Empty homes | Older persons housing (C2) | ||||||
2017/18 | 3,247 | 2,289 | 18 | 68 | 6 | 2,333 | -914 | |
2018/19 | 3,247 | 3,430 | 0 | 94 | 3 | 3,521 | +274 | |
2019/20 | 3,247 | 3,333 | 0 | 58 | 5 | 3,386 | +139 | |
2020/21 | 3,247 | 2,950 | 0 | 66 | 7 | 3,009 | -238 | |
2021/22 | 3,247 | 3,264 | 0 | 51 | 26 | 3,289 | +42 | |
2022/23 | 3,247 | 2,704 | 0 | 6 | 7 | 2,703 | -544 | |
2023/24 | 3,247 | 4,340 | 0 | 114 | 13 | 4,441 | +1,194 | |
TOTAL | 22,749 | 22,310 | 18 | 457 | 67 | 22,682 | -47 | |
Housing completions have remained overwhelmingly located on brownfield land which is reflective of the Council’s overall strategy for sustainable growth focused in the City Centre and Main Urban Area, with all years meeting the target of at least 55% being delivered on PDL. More planning permissions have been granted for housing over the past five years than at any time including a record-breaking level in 2022/23 of over 10,000 units in a single year. The number of homes approved are now well above housing requirement figures.
Homes approved and completed by land type and % of delivery; 2017-24 | |||||||
Year | Brownfield | Greenfield | Total (gross) | ||||
Approved | Completed | % Delivery* | Approved | Completed | % Delivery* | ||
2017/18 | 5,377 | 1,727 | 75.4% | 2,283 | 562 | 24.6% | 2,289 |
2018/19 | 8,300 | 2,741 | 79.9% | 1,303 | 689 | 20.1% | 3,430 |
2019/20 | 2,818 | 2,584 | 77.5% | 901 | 749 | 22.5% | 3,333 |
2020/21 | 6,259 | 2,358 | 79.9% | 941 | 592 | 20.1% | 2,950 |
2021/22 | 5,561 | 2,562 | 78.5% | 2241 | 702 | 21.5% | 3,264 |
2022/23 | 6,743 | 1,651 | 61% | 4,219 | 1,052 | 39% | 2,704 |
2023/24 | 5,227 | 3,422 | 78.8% | 928 | 918 | 21.2% | 4,340 |
*Gross building new and converted (not including care homes and empty properties/demolitions) | |||||||
During this period, the Council has consistently made a clear priority to maximise the use of brownfield land in meeting the need for new homes across the district and are actively engaged with incentivising the bringing back into use of brownfield sites. 76% of all planning approvals since 2017/18 have been on brownfield sites and completions remain overwhelmingly on previously developed land, which is reflective of growth focused in the City Centre and Main Urban Area.
The increases of housing land supply and delivery within the City Centre and Main Urban Area, although planned through the Core Strategy, have far exceeded expectations. The success of the City Centre as a location for sustained housing growth has come forward on sites that were not allocated as part of the SAP with schemes being proposed on unidentified “windfall” sites. The SAP was adopted in July 2019 and the 2014 CS was then lowered in September 2019 by the adoption of the 2019 CS.
At the same time, the Council had overseen record levels of planning permissions approved since 1st April 2017 on the identified supply which was then allocated in the SAP but, critically, also on new sites that were not allocated in SAP but would have met the size thresholds for allocation. These sites came into focus as part of the High Court proceedings and Judgment as “large windfall” sites. The Core Strategy included the need to discount a windfall allowance (estimated conservatively at 500 dwellings per annum for small sites) but this was far exceeded by the actual level of large windfall that came forward.
The determination of the High Court Order through the SAP Remittal was to take account of all the increases to supply and delivery through windfall and recalculate against the Core Strategy requirement to understand if there remained a numerical need to release Green Belt. The over provision of housing (+11,268 dwellings at the time) reflected the size of contribution made by windfall sites in the City Centre and Main Urban Area and thereby avoided the release of Green Belt land as the SAP advanced the reason for Green Belt release (the “exceptional circumstances”) to meet numerical need only. This has since contributed to an overall supply picture that is disproportionately focussed on the delivery of flats and apartments within the City Centre and Main Urban Area and a reducing number of opportunities for traditional homes in the outer areas. It is important for LLP to have a clearly evidenced understanding of anticipated windfall across the plan period.
Current housing land supply and delivery since 1st April 2024
For LLP, the housing land supply is comprised of the following components:
- Homes delivered as completions on sites since 1st April 2024
- Remaining capacity yet to be completed on sites under construction
- Sites with planning permission yet to be commenced
- Deliverable capacity of yet to be implemented housing allocations
In 2024/25, 4,311 new homes were delivered as net completions. In addition, supply for 40,769 new homes remined yet to be built on sites with planning permission at 1st April 2025 and land allocations that remain deliverable. The total housing land supply for LLP is 45,080. The target for land allocations will therefore be the overall requirement (including a suggested 10% buffer) minus the current supply (as above) and an appropriate windfall allowance (including a demolition rate).
Windfall and demolitions
Windfall is from sites not specifically identified in the development plan. Windfall has historically been a consistent and reliable source of housing delivery given the size and geography of Leeds with a plentiful supply of previously developed land. The NPPF at Paragraph 73 sets out that local planning authorities should support the development of windfall sites through their policies and decisions - giving great weight to the benefits of using suitable sites within existing settlements for homes. At Paragraph 75 the NPPF explains that where an allowance is to be made for windfall sites as part of anticipated supply, there should be compelling evidence that they will provide a reliable source of supply.
The previous windfall allowance in the SAP significantly underestimated windfall delivery as a rate of 500 dwellings per annum was based on evidence from a previous period where residential development in the city centre had dropped to almost zero and the land supply in outer areas. In the following years, the resurgence of the city centre led to record levels of planning permissions on sites that were not identified in the plan. The 500 units per annum were expected on sites either too small to be monitored (under 5 units) or below the size threshold of 0.25ha to be included in the Strategic Housing Land Availability Assessment (SHLAA). However, this did not account for the scale of windfall sites that did come forward that met the threshold to be included but were not in the SAP. This all means that the Council has had to revisit the evidence on windfall to determine the most appropriate figure for LLP.
The Council’s Housing Land Monitor (HLM) system records sites which are capable of delivering 5 or more dwellings but the Council continues to recognise the important housing delivery contribution made by sites delivering less than 5 dwellings. All future schemes that are under 5 dwellings or 0.25 hectares will continue to be windfall because we are not seeking to allocate sites of this size. The thresholds relevant to considering what will be additional windfall development are set out below:
- Unidentified sites that add 5 or more dwellings provides the threshold for monitoring schemes as sites i.e. to be included as a specific site in the current supply
- Sites with a boundary size that is 0.25 hectares or greater is the proposed size threshold for site allocations (based on PPG threshold).
The types of windfall sites are summarised here:
Windfall type | Description | Monitored as HLM sites | Monitored as SHLAA sites | Contribution to future supply |
Small schemes | Approved schemes with creating less than 5 additional units (gross) | No | No | Year 1 onwards |
Small sites (<0.25 ha) | Schemes with boundary area less than 0.25 hectares on non-allocated sites that create 5 or more additional units (gross). Mix of vacant and occupied sites | Yes | No | Year 4 onwards (as Year 1 - Year 3 will be identified as commitments) |
Large sites (0.25 ha or greater) | Schemes with boundary area of 0.25 hectares or greater that create 5 or more additional units (gross). Mainly occupied sites | Yes | Yes | Year 4 onwards (as Year 1 - Year 3 will be identified as commitments) |
The Council have analysed the period between 1st April 2019 and 31st March 2025 (6-year period) to analyse past levels of windfall completions. 1st April 2019 was chosen as start of financial year in which the SAP was adopted and the Council had a fully up-to-date local plan for housing allocations.
Windfall type | From | To | Total | Per annum (Actual) |
Small schemes | April 2019 | March 2025 | 953 | 158 |
Small sites (<0.25 ha) & Large sites (0.25 ha or greater) | April 2019 | March 2025 | 6,782 | 1,130 |
Figures are rounded to 150 per annum on small schemes and 1,100 per annum on small and large sites. The plan period up to 31st March 2042 is 17 years from the date of analysis. The estimated total from small and large site windfall is 17 x 1,100 = 18,700. However, some future windfall is already known as this has been captured as commitments in the current supply so there is a need to deduct these from the total. This total figure is 6,388. To avoiding double counting, future windfall from small and large sites is calculated to be 18,700 - 6,388 = 11,907.
This type of windfall will occur from Year 4 onwards (looking forward from any point in time) because all completions in Year 1-3 will be either under construction or have full planning permission based on the housing trajectory. Expected additional windfall will therefore occur from 2028 to 2042 (14 years). On this basis, the annual estimate from small and large windfall sites is calculated to be 11,907 / 14 = 850 per annum.
Windfall type | Total | Per annum (Actual) | Per annum (Plan) | Contribution to future supply |
Small schemes | 953 | 158 | 150 | Year 1 onwards |
Small sites (<0.25 ha) & Large sites (0.25 ha or greater) | 11,907 | 851 | 850 | Year 4 onwards (as Year 1 - Year 3 will be identified as commitments) |
This analysis suggests that a windfall allowance of 150 per annum for Year 1 onwards (including small schemes only) and 1,000 units per annum (including small schemes and small & large sites) is justified from Year 4 onwards (from the point of any calculation). As at 1st April 2025 the calculation would be 14,450 for the plan period.
Windfall type | Per annum (Plan) | From | Years | Total |
Small schemes | 150 | 2025/26 | 17 | 2,550 |
Small sites (<0.25 ha) & Large sites (0.25 ha or greater) | 850 | 2028/29 | 14 | 11,900 |
Demolition rates in Leeds have been minimal following the completion of bulk clearance schemes in 2010. The SAP applied a demolition rate of 150 units per annum from the Core Strategy (2019) that was carried forward from the Core Strategy (2012) when demolitions evidence was made against a previous 10-year period from 2002 when bulk clearance schemes were still operational.
The rate of demolition in Leeds since 1st April 2012 has on average been 24 units per annum as recorded in annual AMR up to 1st April 2024. However, in 2024/25 demolitions increased to 271 units the majority of which were part of a single bulk clearance scheme of the Highways tower blocks and maisonettes in Killingbeck. Over the last 5 years demolitions now average 64 units per annum and 97 units per annum over the last 3 years. Setting a rate of 100 units per annum is appropriate and is considered conservative yet flexible for LLP. This puts total net windfall (additions minus losses) at 50 per annum for Year 1 to 3 and 900 per annum Year 4 to the end of the plan period.
Type | Year 1 | Year 2 | Year 3 | Year 4 to 2042 |
Windfall | 150 | 150 | 150 | 1,000 |
Demolitions/losses | 100 | 100 | 100 | 100 |
Net windfall | 50 | 50 | 50 | 900 |
Total net windfall from 1st April 2025 to the end of the plan period would be 12,750 dwellings.
Net windfall | Per annum | From | Years | Total |
Year 1 to 3 | 50 | 2025/26 | 3 | 150 |
Year 4 to 2042 | 900 | 2028/29 | 14 | 12,600 |
Net windfall from 1st April 2025 | 12,750 | |||
The evidence demonstrates a compelling case for the inclusion of a windfall allowance in the housing land requirement. Windfall sites have historically made a consistent contribution to the overall housing delivery in the area and are likely to continue to do so.
Achievability of current housing land supply
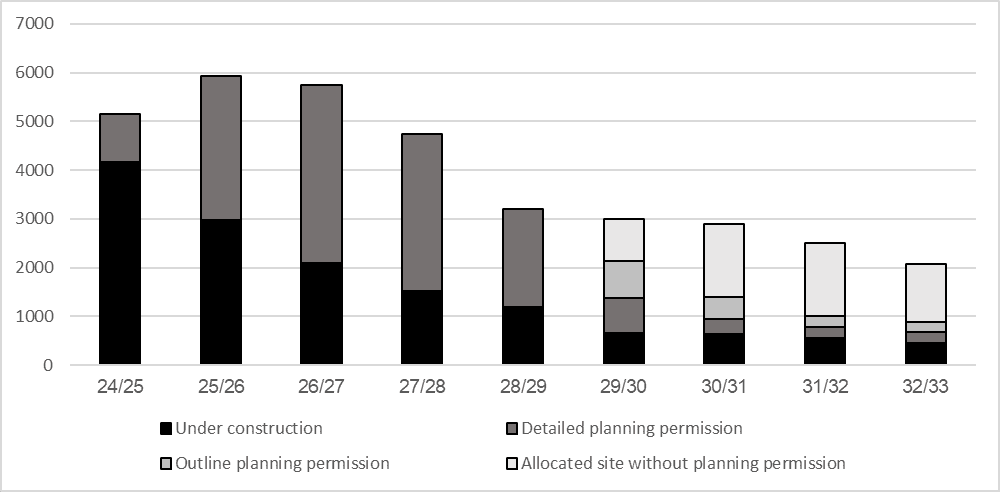
In December 2024, the Council published the SHLAA with an accompanying five-year housing land supply statement that detailed a short-term supply of 6.6 years comprising of sites under construction of with detailed planning permission. Beyond the short-term period, the supply picture is less secure with a reducing number of sites with outline planning permissions and remaining land allocations that are yet to be built. The NPPF at Paragraph 72 provides more detail on the evidence sought between a short-term site (Year 1 to 5) which must be considered deliverable and a medium term to longer term site (Year 6+) which must be considered developable.
In April 2025, the current housing land supply in the immediate and short-term remains healthy, which is reflective of sites under construction and those with detailed planning permission. However, the medium to long term supply is reduced, particularly the long-term picture. The current supply also remains focussed on the City Centre and Main Urban Area.
Figure 1: 2024 SHLAA Trajectory
Need for land allocations
The need for land allocations is determined by the total requirement across the plan period minus the existing housing land supply that remains deliverable within the plan period inclusive of the net windfall allowance.
Requirement | Buffer Total | Requirement - Total |
69,834 | 6,983 | 76,817 |
Homes delivered in 2024/25 | Existing supply sites | Supply - Total |
4,311 | 40,769 | 45,080 |
| ||
Requirement - Total | Supply - Total | Balance |
75,817 | 45,080 | 31,737 |
Net Windfall | 12,750 | |
Land allocations in LLP | 18,987 | |
The total requirement including a 10% is 76,817 new homes between 1st April 2024 and 31st March 2042. The total existing supply and new homes already delivered is 45,080 with net windfall of 12,750. LLP would therefore need to make new land allocations for 18,987 new homes across the plan period.
Distribution
When planning for new housing, LPAs must consider the scale and the distribution of growth. This work informs the distribution of potential housing allocations. The SHMA has determined overall housing need for the district based on the NPPF and Government’s standard method for LHN. The SHMA has also determined affordable housing, specialist housing needs and Census-based profiles for 11 sub-areas based on the Council’s 10 Committee Areas (plus City Centre). The SHMA also provides sub-area reports based on Census outputs at the Office of National Statistics (ONS) Output Areas level. The LLP needs to translate the overall requirements to these sub-areas and Settlement Network to reflect spatial strategy options.
During early scoping exercises in 2023, the Council considered a range of approaches including a continuation of historic trends of delivery and proportional growth based on population change inclusive of natural change across the plan period. However, these were discounted as they were considered not either to be reflective of actual need or based on a planned strategy for growth. Evidenced consideration of scale and of new housing is therefore informed by a range of scenarios to create options for the distribution of land to take account of the spatial strategy. The strategy options have been informed by a number of scenarios:
Scenario A | Affordable need distribution apportioned to affordable housing needs identified by the SHMA |
Scenario B | Stock based distribution apportioned to location of existing dwellings |
Scenario C | NPPF based distribution based on 0.8% stock uplift and localised affordable needs from SHMA |
The Council has considered the advantages and disadvantages of each scenario to decide on a preferred approach that would most sensibly support an overall strategy where all options make use of existing supply. This requires consideration of consultation responses from the scoping consultation in February 2023.
Scenario | Advantages | Disadvantages |
A - Affordable housing |
|
|
B - Existing stock |
|
|
C - NPPF |
|
|
On the balance and weighting of the advantages and disadvantages of each option, the Council considers that Scenario C is the preferred approach to distribution. This option has the most benefits and is evidentially consistent with the Government’s own calculation of LHN. It is the national agenda for housing growth as applied to Leeds based on our own evidence of affordable housing needs in the updated SHMA. Whilst it should be noted that this is a distribution of need and not necessarily reflective of where the most suitable sites can be selected, it can be calculated from the district-wide level to both SHMA sub-areas and the Settlement Network.
This option has been considered as part of Sustainability Assessment inclusive of a 10% buffer alongside the alternative, which would be without the inclusion of a buffer:
Option 1: Update policy to plan for new housing based on the LHN requirement with a 10% additional buffer
Option 2: Update policy to plan for new housing based on the LHN requirement with no buffer
Housing requirement by Sub-area
For the purposes of understanding local housing evidence in the SHMA, the district was split into 11 sub-areas. These are based on the Council’s 10 Committee Areas plus the City Centre with boundaries drawn to the nearest ONS Output Area so that data can be used and displayed at lower geographies. To help inform how much housing should be planned for in different parts of the district, the same approach that the government uses to identify the housing requirement for each local authority has applied to each of the plans sub-areas.
To calculate the housing requirement by sub-area, the existing stock of dwellings is taken for each area and a 0.8% uplift is applied annually to apportion growth. The proportion of overall affordable housing need in the SHMA is then applied to each area to make the total figure equate to the overall LHN requirement for the district. This is the ‘Gross Total Need’.
The current supply is calculated using the Unique Property Reference Number (UPRN) of each individual new home delivered since 1st April 2024. This is added to the location and capacity of existing sites either under construction, with planning permission and deliverable allocations yet to be built. This is the current supply which is deducted from the ‘Gross Total Need’ to provide the ‘Net Total Need’.
The over-provision of current supply in the City Centre is redistributed equally across the district need to utilise the capacity of existing commitments to adjust the need in other sub-area for land allocations. The net windfall allowance is applied equally across each sub-area. This gives the ‘Adjusted Net Requirement’ by sub-area.
The SHMA tells us that there is a need for new housing throughout the district. These needs are broken down by 11 sub-areas, reflecting the broad inner and outer geography of the District and the City Centre. These needs are set out in the Table below. The full calculation is in Appendix 1.
Area | Stock of dwellings (Apr 2024) | Gross Total Need (LHN) | Net Total Need (Individual sub-area) | Adjusted Net Requirement (District-wide)* |
City Centre | 24,221 | 4,090 | -17,861 | 0 |
Inner East | 37,521 | 7,965 | 6,301 | 2,412 |
Inner North East | 31,948 | 6,169 | 5,670 | 2,170 |
Inner North West | 29,724 | 6,260 | 2,326 | 891 |
Inner South | 32,820 | 6,519 | 5,161 | 1,976 |
Inner West | 33,748 | 7,103 | 4,684 | 1,793 |
Outer East | 42,917 | 8,636 | 2,423 | 928 |
Outer North East | 28,864 | 5,639 | 2,186 | 837 |
Outer North West | 42,325 | 8,663 | 7,371 | 2,822 |
Outer South | 43,071 | 8,667 | 6,837 | 2,617 |
Outer West | 34,288 | 7,106 | 6,639 | 2,542 |
Leeds | 381,447 | 76,817 | 31,737 | 18,987 |
*Sub-area totals are subject to rounding
District-wide: The current district-wide supply within Leeds is 40,769 on sites with planning permission and deliverable allocations yet to be built. The existing stock of dwellings was 381,447 at 1st April 2024. With a 0.8% annual stock increase and district wide affordable need to meet the Government’s Local Housing Need (LHN) requirement including a 10% buffer, the Gross Total Need is 76,817 and a net requirement of 31,737, which takes into account the current supply and 4,311 new homes already completed during 2024/25. The final Adjusted Net Requirement following the redistribution of the supply surplus in the City Centre and windfall is 18,987. City Centre: The current supply within City Centre is 19,590 on sites with planning permission and deliverable allocations yet to be built. The existing stock of dwellings was 24,221 at 1st April 2024. With a 0.8% annual stock increase and an affordable need of 1.4% of the district wide total, the Gross Total Need is 4,090 and a net requirement of -17,861, which takes into account the current supply and 2,361 new homes already completed during 2024/25. The final Adjusted Net Requirement following the redistribution of the supply surplus in the City Centre and windfall is zero. The supply surplus within the city centre, which makes most effective use of existing commitments and previously developed land, is retained, and redistributed towards the need to make land allocations across the district. Inner East: The current supply within Inner East is 1,509 on sites with planning permission and deliverable allocations yet to be built. The existing stock of dwellings was 37,521 at 1st April 2024. With a 0.8% annual stock increase and an affordable need of 12.4% of the district wide total, the Gross Total Need is 7,965 and a net requirement of 6,301, which takes into account the current supply and 155 new homes already completed during 2024/25. The final Adjusted Net Requirement following the redistribution of the supply surplus in the City Centre and windfall is 2,412. Inner North East: The current supply within Inner North East is 416 on sites with planning permission and deliverable allocations yet to be built. The existing stock of dwellings was 31,948 at 1st April 2024. With a 0.8% annual stock increase and an affordable need of 6.7% of the district wide total, the Gross Total Need is 6,169 and a net requirement of 5,670, which takes into account the current supply and 83 new homes already completed during 2024/25. The final Adjusted Net Requirement following the redistribution of the supply surplus in the City Centre and windfall is 2,170. Inner North West: The current supply within Inner North West is 3,696 on sites with planning permission and deliverable allocations yet to be built. The existing stock of dwellings was 29,724 at 1st April 2024. With a 0.8% annual stock increase and an affordable need of 9.5% of the district wide total, the Gross Total Need is 6,260 and a net requirement of 2,326, which takes into account the current supply and 238 new homes already completed during 2024/25. The final Adjusted Net Requirement following the redistribution of the supply surplus in the City Centre and windfall is 891. Inner South: The current supply within Inner South is 1,303 on sites with planning permission and deliverable allocations yet to be built. The existing stock of dwellings was 32,820 at 1st April 2024. With a 0.8% annual stock increase and an affordable need of 8.0% of the district wide total, the Gross Total Need is 6,519 and a net requirement of 5,161, which takes into account the current supply and 55 new homes already completed during 2024/25. The final Adjusted Net Requirement following the redistribution of the supply surplus in the City Centre and windfall is 1,967. Inner West: The current supply within Inner West is 2,289 on sites with planning permission and deliverable allocations yet to be built. The existing stock of dwellings was 33,748 at 1st April 2024. With a 0.8% annual stock increase and an affordable need of 10.8% of the district wide total, the Gross Total Need is 7,103 and a net requirement of 4,684, which takes into account the current supply and 130 new homes already completed during 2024/25. The final Adjusted Net Requirement following the redistribution of the supply surplus in the City Centre and windfall is 1,793. Outer East: The current supply within Outer East is 5,759 on sites with planning permission and deliverable allocations yet to be built. The existing stock of dwellings was 42,917 at 1st April 2024. With a 0.8% annual stock increase and an affordable need of 11.2% of the district wide total, the Gross Total Need is 8,636 and a net requirement of 2,423, which takes into account the current supply and 454 new homes already completed during 2024/25. The final Adjusted Net Requirement following the redistribution of the supply surplus in the City Centre and windfall is 928. Outer North East: The current supply within Outer North East is 3,290 on sites with planning permission and deliverable allocations yet to be built. The existing stock of dwellings was 28,864 at 1st April 2024. With a 0.8% annual stock increase and an affordable need of 6.5% of the district wide total, the Gross Total Need is 5,639 and a net requirement of 2,186, which takes into account the current supply and 163 new homes already completed during 2024/25. The final Adjusted Net Requirement following the redistribution of the supply surplus in the City Centre and windfall is 837. Outer North West: The current supply within Outer North West is 1,116 on sites with planning permission and deliverable allocations yet to be built. The existing stock of dwellings was 42,325 at 1st April 2024. With a 0.8% annual stock increase and an affordable need of 12.0% of the district wide total, the Gross Total Need is 8,663 and a net requirement of 7,371, which takes into account the current supply and 176 new homes already completed during 2024/25. The final Adjusted Net Requirement following the redistribution of the supply surplus in the City Centre and windfall is 2,822. Outer South: The current supply within Outer South is 1,433 on sites with planning permission and deliverable allocations yet to be built. The existing stock of dwellings was 43,071 at 1st April 2024. With a 0.8% annual stock increase and an affordable need of 11.2% of the district wide total, the Gross Total Need is 8,667 and a net requirement of 6,837, which takes into account the current supply and 397 new homes already completed during 2024/25. The final Adjusted Net Requirement following the redistribution of the supply surplus in the City Centre and windfall is 2,617. Outer West: The current supply within Outer West is 368 on sites with planning permission and deliverable allocations yet to be built. The existing stock of dwellings was 34,288 at 1st April 2024. With a 0.8% annual stock increase and an affordable need of 10.3% of the district wide total, the Gross Total Need is 7,106 and a net requirement of 6,639, which takes into account the current supply and 99 new homes already completed during 2024/25. The final Adjusted Net Requirement following the redistribution of the supply surplus in the City Centre and windfall is 2,542. |
Not all of the 76,817 homes need to be found through this plan, as planning permission has already been granted for a significant number of new homes, and there are also opportunities for development on sites allocated through the Site Allocations Plan and Aire Valley Area Action Plan i.e. ‘current supply’. A number of new homes have also been built since 1st April 2024 (the start of the plan period) i.e. ‘recent delivery’.
In the City Centre more development is already planned than would be needed to meet a requirement purely based on the Government’s LHN and an allowance can also be made for windfall development that arises through the plan period but isn’t identified at the beginning. This means:
- the existing stock of dwellings was 381,447 homes at 1st April 2024
- with a 0.8% annual stock increase and district-wide affordable need in line with the LHN requirement - and including a 10% buffer - the total requirement is 76,817 homes
- as at 1st April 2025 there are 40,769 homes yet to be built, on sites with planning permission and deliverable allocations – known as ‘current supply’
- during 2024/25 4,311 net new homes were completed – ‘recent delivery’
- therefore, the LLP needs to identify 31,737 homes in the LLP, which considers the current supply and recent delivery
These homes will be identified in two ways:
- windfall sites where the Council has evidence to expect 12,750 homes to arise during the plan period
- newly allocated sites for around 18,987 homes
Housing requirement by Settlement Network
The Settlement Network Supporting Paper explains that it is common for Local Plans to define a settlement network as part of their spatial strategy. The proposed Settlement Network for Leeds will be used through the LLP will help to inform the type and scale of development appropriate in different locations. To help inform how much housing should be planned for in different parts of the district, the same approach that the government uses to identify the housing requirement for each local authority has applied to the Main Urban Area (this includes a wide variety of different neighbourhoods, including areas such as Horsforth and Pudsey, which have their own identities as part of the wider City), each settlement across the rest of the district and the countryside in each sub-area.
Housing need can be attributed by using the boundaries of settlements to calculate the existing stock of dwellings within each settlement from UPRNs. This provides the basis of the 0.8% annual stock-based increase based on the proportion of existing dwellings within each settlement. The SHMA sets out data on affordable need by sub-area. This can then be calculated to settlements by taking the proportion of dwellings within a settlement that are part of a sub-area and applying that proportional of need in the sub-area to the settlement. This is the ‘Gross Total Need’ by settlement.
The current supply is calculated using the UPRN of each individual new home delivered since 1st April 2024. This is added to the location and capacity of existing sites either under construction, with planning permission and deliverable allocations yet to be built. This is the current supply which is deducted from the ‘Gross Total Need’ to provide the ‘Net Total Need’.
The over-provision of supply in the City Centre is redistributed across the district to utilise the capacity of existing commitments to adjust the need in other settlements for land allocations. The over-provision of supply in the settlements is redistributed across the sub-area to adjust the need in other settlements to make land allocations that equate to the sub-area total. The net windfall allowance is then applied proportionally across each settlement from the sub-area. This gives the ‘Adjusted Net Requirement’ by settlement. The full calculation is set out in Appendix 2.
*Settlement totals are subject to rounding
Explanation of requirements for land allocations
The result of overall housing distribution by both sub-areas and settlements indicates additional housing needs in all locations except for the City Centre, which has more than enough new homes committed in the current supply. This surplus in the city centre has eased pressures in the outer areas and settlements having reduced the overall requirement to make new land allocations. Land allocations are required across the district for 18,146 new homes to fully meet local needs. This is in fulfilment of Objective 1 of LLP to ‘Identify land for 75,976 homes to deliver the 69,069 new homes required to meet local housing needs across the district’.
Conclusions for Leeds Local Plan
The overall housing need and distribution of housing provides the framework for making land allocations. The selection of sites will not, however, be determined by strictly meeting the numerical need of each sub-area or settlement. The figures are intended as a guide to identify the most suitable sites across the district that can most meaningfully contribute to both local and overall needs. The figures for sub-area and settlements are not targets for either performance or land allocations. The housing target is to deliver the LHN figure of 3,851 new homes per annum across the district and identify land for 75,976 new homes in the plan period to achieve this.
Both the residual need requirement and the illustrative adjusted needs requirement provide a starting point for what local housing needs in place might look like (i.e. a range between the two). However, these figures are not proposed plan targets. Deciding how much housing should be met in each area place will need to take into account other plan objectives, such as delivering affordable housing, delivering a housing mix, the Green belt, the role of places, the spatial strategy, connectivity and active travel opportunities, regeneration, infrastructure, previously developed land, achieving higher densities of development and avoiding flood risk. Further details on how the Plan will meet these needs and decide which sites should be developed is set out in the ‘Introduction, Vision and Objectives’ chapter, and in the introduction to the site assessments.
Land allocations for housing in LLP will be determined by detailed site assessments that factor in the strategy to maximise brownfield land, identify the most sustainable locations and release Green Belt land in most appropriate locations. The Council has choices to make on which sites to allocate based on suitability, deliverability, sustainability, and contribution to deliver plan objectives.
Settlement | Stock of dwellings (April 2024) | Gross Total Need | Net Total Need (Individual) | Adjusted Net Requirement (District-wide)* |
City Centre | 24,221 | 4,090 | -17,861 | 0 |
Main Urban Area - Inner East | 37,521 | 7,965 | 6,301 | 2,412 |
Main Urban Area - Inner North East | 31,868 | 6,153 | 5,654 | 2,165 |
Outside Settlements - Inner North East | 80 | 15 | 15 | 6 |
Main Urban Area - Inner North West | 29,690 | 6,253 | 2,339 | 891 |
Outside Settlements - Inner North West | 30 | 6 | -18 | 0 |
Main Urban Area - Inner South | 32,815 | 6,518 | 5,160 | 1,975 |
Outside Settlements - Inner South | 5 | 1 | 1 | 0 |
Main Urban Area - Inner West | 33,581 | 7,067 | 4,722 | 1,793 |
Outside Settlements - Inner West | 167 | 35 | -39 | 0 |
Main Urban Area - Outer East | 23,059 | 4,640 | -894 | 0 |
Allerton Bywater | 2,566 | 516 | 477 | 132 |
Garforth | 6,905 | 1,390 | 1,172 | 324 |
Great Preston | 385 | 77 | 78 | 22 |
Kippax | 4,616 | 929 | 917 | 253 |
Ledsham | 53 | 11 | 11 | 3 |
Ledston | 86 | 17 | 17 | 5 |
Little Preston | 106 | 21 | 21 | 6 |
Methley Junction | 407 | 82 | 82 | 23 |
Micklefield | 1,227 | 247 | -42 | 0 |
Mickletown/Methley | 1,484 | 299 | 287 | 79 |
Swillington | 1,349 | 271 | 271 | 75 |
Outside Settlements - Outer East | 674 | 136 | 26 | 7 |
Main Urban Area - Outer North East | 10,561 | 2,063 | 472 | 163 |
Aberford | 587 | 115 | 110 | 38 |
Bardsey | 678 | 132 | 132 | 46 |
Barwick in Elmet | 1,107 | 216 | 215 | 74 |
Boston Spa | 2,253 | 440 | 393 | 136 |
Bramham | 691 | 135 | 105 | 36 |
Clifford | 664 | 130 | 130 | 45 |
Collingham | 1,130 | 221 | 120 | 41 |
East Keswick | 373 | 73 | 73 | 25 |
Harewood | 190 | 37 | 37 | 13 |
Linton | 211 | 41 | 16 | 6 |
Scarcroft | 521 | 102 | 102 | 35 |
Scholes | 910 | 178 | 169 | 58 |
Shadwell | 618 | 121 | 113 | 39 |
Thorner | 639 | 125 | 125 | 43 |
Thorp Arch | 128 | 25 | 25 | 9 |
Thorp Arch Grange | 342 | 67 | 66 | 23 |
Walton | 64 | 13 | 13 | 4 |
Wayside Gardens (Scarcroft) | 52 | 10 | 9 | 3 |
Wetherby | 5,554 | 1,085 | -94 | 0 |
Outside Settlements - Outer North East | 1,595 | 312 | -139 | 0 |
Main Urban Area - Outer North West | 15,669 | 3,207 | 2,889 | 1,106 |
Bramhope | 1,755 | 359 | 334 | 128 |
Guiseley / Yeadon / Rawdon | 14,550 | 2,978 | 2,866 | 1,097 |
Horsforth Vale | 513 | 105 | 105 | 40 |
Otley | 6,617 | 1,354 | 743 | 285 |
Pool in Wharfedale | 856 | 175 | 125 | 48 |
Outside Settlements - Outer North West | 2,365 | 484 | 308 | 118 |
Main Urban Area - Outer South | 817 | 164 | 164 | 63 |
Carlton | 391 | 79 | -17 | 0 |
Drighlington | 2,583 | 520 | 392 | 149 |
East Ardsley (north) | 524 | 105 | 105 | 40 |
Gildersome | 2,735 | 550 | 519 | 198 |
Lofthouse / Robinhood | 2,757 | 555 | 554 | 211 |
Morley | 15,841 | 3,188 | 2,514 | 958 |
Oulton (south) | 236 | 47 | -12 | 0 |
Rothwell / Oulton / Woodlesford | 8,686 | 1,748 | 1,559 | 594 |
Thorpe on the Hill | 434 | 87 | 87 | 33 |
Tingley / West Ardsley / East Ardsley | 7,207 | 1,450 | 948 | 361 |
Outside Settlements - Outer South | 860 | 173 | 23 | 9 |
Main Urban Area - Outer West | 29,926 | 6,202 | 5,831 | 2,232 |
Calverley | 1,570 | 325 | 320 | 123 |
Carrwood Park (Tyresal) | 270 | 56 | 48 | 18 |
New Farnley | 1,061 | 220 | 163 | 62 |
Troydale | 101 | 21 | 21 | 8 |
Tyersal | 656 | 136 | 112 | 43 |
Upper Moor Side | 55 | 11 | 11 | 4 |
Outside Settlements - Outer West | 649 | 135 | 133 | 51 |
Leeds | 381,447 | 76,817 | 31,737 | 18,987 |
Explanation of requirements for land allocations
The result of overall housing distribution by both sub-areas and settlements indicates additional housing needs in all locations except for the City Centre, which has more than enough new homes committed in the current supply. This surplus in the city centre has eased pressures in the outer areas and settlements having reduced the overall requirement to make new land allocations. Land allocations are required across the district for 18,987 new homes to fully meet local needs. This is in fulfilment of Objective 1 of LLP to ‘Identify land for 76,817 homes to deliver the 69,834 new homes required to meet local housing needs across the district’.
Conclusions for Leeds Local Plan
The overall housing need and distribution of housing provides the framework for making land allocations. The selection of sites will not, however, be determined by strictly meeting the numerical need of each sub-area or settlement. The figures are intended as a guide to identify the most suitable sites across the district that can most meaningfully contribute to both local and overall needs. The figures for sub-area and settlements are not targets for either performance or land allocations. The housing target is to deliver the LHN figure of 3,896 new homes per annum across the district and identify land for 76,817 new homes in the plan period to achieve this.
Both the residual need requirement and the illustrative adjusted needs requirement provide a starting point for what local housing needs in place might look like (i.e. a range between the two). However, these figures are not proposed plan targets. Deciding how much housing should be met in each area place will need to take into account other plan objectives, such as delivering affordable housing, delivering a housing mix, the Green Belt, the role of places, the spatial strategy, connectivity and active travel opportunities, regeneration, infrastructure, previously developed land, achieving higher densities of development and avoiding flood risk. Further details on how the Plan will meet these needs and decide which sites should be developed is set out in the ‘Introduction, Vision and Objectives’ chapter, and in the introduction to the site assessments.
Land allocations for housing in LLP will be determined by detailed site assessments that factor in the strategy to maximise brownfield land, identify the most sustainable locations and release Green Belt land in most appropriate locations. The Council has choices to make on which sites to allocate based on suitability, deliverability, sustainability, and contribution to deliver plan objectives.
Appendix 1 - Housing needs distribution by Sub-area
Area | Net Completions since 1st April 2024 | Current supply (1st April 2025) | Stock of dwellings (1st April 2024) | Annual 0.8% of stock | SHMA Affordable Need % | Affordable additions to stock (NPPF) | Gross Total Need | Net Total Need (Individual) | Adjusted Net Need (District-wide) |
City Centre | 2,361 | 19,590 | 24,221 | 3,875 | 1.4% | 203 | 4,079 | -17,872 | 0 |
Inner East | 155 | 1,509 | 37,521 | 6,003 | 12.4% | 1,858 | 7,861 | 6,197 | 2,306 |
Inner North East | 83 | 416 | 31,948 | 5,112 | 6.7% | 1,001 | 6,112 | 5,613 | 2,089 |
Inner North West | 238 | 3,696 | 29,724 | 4,756 | 9.5% | 1,424 | 6,180 | 2,246 | 836 |
Inner South | 55 | 1,303 | 32,820 | 5,251 | 8.0% | 1,200 | 6,451 | 5,093 | 1,895 |
Inner West | 130 | 2,289 | 33,748 | 5,400 | 10.8% | 1,612 | 7,012 | 4,593 | 1,709 |
Outer East | 454 | 5,759 | 42,917 | 6,867 | 11.2% | 1,675 | 8,542 | 2,329 | 867 |
Outer North East | 163 | 3,290 | 28,864 | 4,618 | 6.5% | 966 | 5,584 | 2,131 | 793 |
Outer North West | 176 | 1,116 | 42,325 | 6,772 | 12.0% | 1,790 | 8,562 | 7,270 | 2,705 |
Outer South | 397 | 1,433 | 43,071 | 6,891 | 11.2% | 1,681 | 8,573 | 6,743 | 2,509 |
Outer West | 99 | 368 | 34,288 | 5,486 | 10.3% | 1,534 | 7,020 | 6,553 | 2,438 |
Leeds | 4,311 | 40,769 | 381,447 | 61,032 | 100.0% | 14,944 | 75,976 | 30,896 | 18,146 |
Appendix 2 - Housing needs distribution by Settlement Network
Key |
Leeds Main Urban Area |
Major Settlements |
Smaller Settlements |
Defined Villages |
Outside hierarchy |
Settlement | Net completions since 1st April 2024 | Current supply at (1st April 2025) | Stock of dwellings (1st April 2024) | Annual 0.8% of stock | SHMA Affordable Need % | Affordable additions to stock (NPPF) | Gross Total Need | Net Total Need (Individual) | Adjusted Net Need (District-wide) |
City Centre | 2,361 | 19,590 | 24,221 | 3,875 | 1.36% | 203 | 4,079 | -17,872 | 0 |
Main Urban Area - Inner East | 155 | 1,509 | 37,521 | 6,003 | 12.43% | 1,858 | 7,861 | 6,197 | 2,306 |
Main Urban Area - Inner North East | 83 | 416 | 31,868 | 5,099 | 6.68% | 998 | 6,097 | 5,598 | 2,083 |
Outside Settlements - Inner North East | 0 | 0 | 80 | 13 | 0.02% | 3 | 15 | 15 | 6 |
Main Urban Area - Inner North West | 242 | 3,672 | 29,690 | 4,750 | 9.52% | 1,423 | 6,173 | 2,259 | 836 |
Outside Settlements - Inner North West | 0 | 24 | 30 | 5 | 0.01% | 1 | 6 | -18 | 0 |
Main Urban Area - Inner South | 55 | 1,303 | 32,815 | 5,250 | 8.03% | 1,200 | 6,450 | 5,092 | 1,895 |
Outside Settlements - Inner South | 0 | 0 | 5 | 1 | 0.00% | 0 | 1 | 1 | 0 |
Main Urban Area - Inner West | 130 | 2,215 | 33,581 | 5,373 | 10.73% | 1,604 | 6,977 | 4,632 | 1,709 |
Outside Settlements - Inner West | 0 | 74 | 167 | 27 | 0.05% | 8 | 35 | -39 | 0 |
Main Urban Area - Outer East | 130 | 5,404 | 23,059 | 3,689 | 6.02% | 900 | 4,590 | -944 | 0 |
Allerton Bywater | 0 | 39 | 2,566 | 411 | 0.67% | 100 | 511 | 472 | 123 |
Garforth | 57 | 161 | 6,905 | 1,105 | 1.80% | 270 | 1,374 | 1,156 | 302 |
Great Preston | -1 | 0 | 385 | 62 | 0.10% | 15 | 77 | 78 | 20 |
Kippax | 0 | 12 | 4,616 | 739 | 1.21% | 180 | 919 | 907 | 237 |
Ledsham | 0 | 0 | 53 | 8 | 0.01% | 2 | 11 | 11 | 3 |
Ledston | 0 | 0 | 86 | 14 | 0.02% | 3 | 17 | 17 | 4 |
Little Preston | 0 | 0 | 106 | 17 | 0.03% | 4 | 21 | 21 | 6 |
Methley Junction | 0 | 0 | 407 | 65 | 0.11% | 16 | 81 | 81 | 21 |
Micklefield | 267 | 22 | 1,227 | 196 | 0.32% | 48 | 244 | -45 | 0 |
Mickletown/Methley | 0 | 12 | 1,484 | 237 | 0.39% | 58 | 295 | 283 | 74 |
Swillington | 0 | 0 | 1,349 | 216 | 0.35% | 53 | 269 | 269 | 70 |
Outside Settlements - Outer East | 1 | 109 | 674 | 108 | 0.18% | 26 | 134 | 24 | 6 |
Main Urban Area - Outer North East | -1 | 1,592 | 10,561 | 1,690 | 2.37% | 353 | 2,043 | 452 | 151 |
Aberford | 0 | 5 | 587 | 94 | 0.13% | 20 | 114 | 109 | 36 |
Bardsey | 0 | 0 | 678 | 108 | 0.15% | 23 | 131 | 131 | 44 |
Barwick in Elmet | 1 | 0 | 1,107 | 177 | 0.25% | 37 | 214 | 213 | 71 |
Boston Spa | -2 | 49 | 2,253 | 360 | 0.50% | 75 | 436 | 389 | 129 |
Bramham | 0 | 30 | 691 | 111 | 0.15% | 23 | 134 | 104 | 35 |
Clifford | 0 | 0 | 664 | 106 | 0.15% | 22 | 128 | 128 | 43 |
Collingham | 38 | 63 | 1,130 | 181 | 0.25% | 38 | 219 | 118 | 39 |
East Keswick | 0 | 0 | 373 | 60 | 0.08% | 12 | 72 | 72 | 24 |
Harewood | 0 | 0 | 190 | 30 | 0.04% | 6 | 37 | 37 | 12 |
Linton | 0 | 25 | 211 | 34 | 0.05% | 7 | 41 | 16 | 5 |
Scarcroft | 0 | 0 | 521 | 83 | 0.12% | 17 | 101 | 101 | 34 |
Scholes | 9 | 0 | 910 | 146 | 0.20% | 30 | 176 | 167 | 56 |
Shadwell | 5 | 3 | 618 | 99 | 0.14% | 21 | 120 | 112 | 37 |
Thorner | 0 | 0 | 639 | 102 | 0.14% | 21 | 124 | 124 | 41 |
Thorp Arch | 0 | 0 | 128 | 20 | 0.03% | 4 | 25 | 25 | 8 |
Thorp Arch Grange | 1 | 0 | 342 | 55 | 0.08% | 11 | 66 | 65 | 22 |
Walton | 0 | 0 | 64 | 10 | 0.01% | 2 | 12 | 12 | 4 |
Wayside Gardens (Scarcroft) | 1 | 0 | 52 | 8 | 0.01% | 2 | 10 | 9 | 3 |
Wetherby | 2 | 1,177 | 5,554 | 889 | 1.24% | 186 | 1,075 | -104 | 0 |
Outside Settlements - Outer North East | 105 | 346 | 1,595 | 255 | 0.36% | 53 | 309 | -142 | 0 |
Main Urban Area - Outer North West | 29 | 289 | 15,669 | 2,507 | 4.44% | 663 | 3,170 | 2,852 | 1,061 |
Bramhope | 16 | 9 | 1,755 | 281 | 0.50% | 74 | 355 | 330 | 123 |
Guiseley / Yeadon / Rawdon | 35 | 77 | 14,550 | 2,328 | 4.12% | 615 | 2,943 | 2,831 | 1,054 |
Horsforth Vale | 0 | 0 | 513 | 82 | 0.15% | 22 | 104 | 104 | 39 |
Otley | 1 | 610 | 6,617 | 1,059 | 1.87% | 280 | 1,339 | 728 | 271 |
Pool in Wharfedale | 0 | 50 | 856 | 137 | 0.24% | 36 | 173 | 123 | 46 |
Outside Settlements - Outer North West | 95 | 81 | 2,365 | 378 | 0.67% | 100 | 478 | 302 | 113 |
Main Urban Area - Outer South | 0 | 0 | 817 | 131 | 0.21% | 32 | 163 | 163 | 60 |
Carlton | 34 | 62 | 391 | 63 | 0.10% | 15 | 78 | -18 | 0 |
Drighlington | 48 | 80 | 2,583 | 413 | 0.67% | 101 | 514 | 386 | 143 |
East Ardsley (north) | 0 | 0 | 524 | 84 | 0.14% | 20 | 104 | 104 | 39 |
Gildersome | -2 | 33 | 2,735 | 438 | 0.71% | 107 | 544 | 513 | 190 |
Lofthouse / Robinhood | 1 | 0 | 2,757 | 441 | 0.72% | 108 | 549 | 548 | 203 |
Morley | 79 | 595 | 15,841 | 2,535 | 4.14% | 618 | 3,153 | 2,479 | 918 |
Oulton (south) | 0 | 59 | 236 | 38 | 0.06% | 9 | 47 | -12 | 0 |
Rothwell / Oulton / Woodlesford | 125 | 64 | 8,686 | 1,390 | 2.27% | 339 | 1,729 | 1,540 | 570 |
Thorpe on the Hill | 0 | 0 | 434 | 69 | 0.11% | 17 | 86 | 86 | 32 |
Tingley / West Ardsley / East Ardsley | 89 | 413 | 7,207 | 1,153 | 1.88% | 281 | 1,434 | 932 | 345 |
Outside Settlements - Outer South | 23 | 127 | 860 | 138 | 0.22% | 34 | 171 | 21 | 8 |
Main Urban Area - Outer West | 33 | 338 | 29,926 | 4,788 | 8.96% | 1,338 | 6,127 | 5,756 | 2,142 |
Calverley | 0 | 5 | 1,570 | 251 | 0.47% | 70 | 321 | 316 | 118 |
Carrwood Park (Tyresal) | 0 | 8 | 270 | 43 | 0.08% | 12 | 55 | 47 | 18 |
New Farnley | 41 | 16 | 1,061 | 170 | 0.32% | 47 | 217 | 160 | 60 |
Troydale | 0 | 0 | 101 | 16 | 0.03% | 5 | 21 | 21 | 8 |
Tyersal | 24 | 0 | 656 | 105 | 0.20% | 29 | 134 | 110 | 41 |
Upper Moor Side | 0 | 0 | 55 | 9 | 0.02% | 2 | 11 | 11 | 4 |
Outside Settlements - Outer West | 1 | 1 | 649 | 104 | 0.19% | 29 | 133 | 131 | 49 |
Leeds | 4,311 | 40,768 | 381,447 | 61,032 | 100.00% | 14,944 | 75,976 | 30,896 | 18,146 |
Discover more

Statement of Representation
Providing details about the purpose of the consultation, how to view the material, how to submit comments, accessibility and privacy notice.

Archived 2025 Consultation Material
This is for information only

Further information
Explains the work already undertaken on the Plan and the new plan-making process

Leeds Local Plan Issues & Options Consultation Report
Summary of the Leeds Local Plan Issues & Options Consultation Summer 2025

Leeds Local Plan Scoping Consultation Document
We would like your views on which general topic areas the Leeds Local Plan should cover and how you would like to be consulted as the plan is developed.
Stay Informed
Follow our projects to get notified of upcoming engagements and the latest project related news.