Previous engagement
Overview of feedback received from the previous perception survey for the area taken in 2019
Lloyd Park area
Perception Survey (2019)
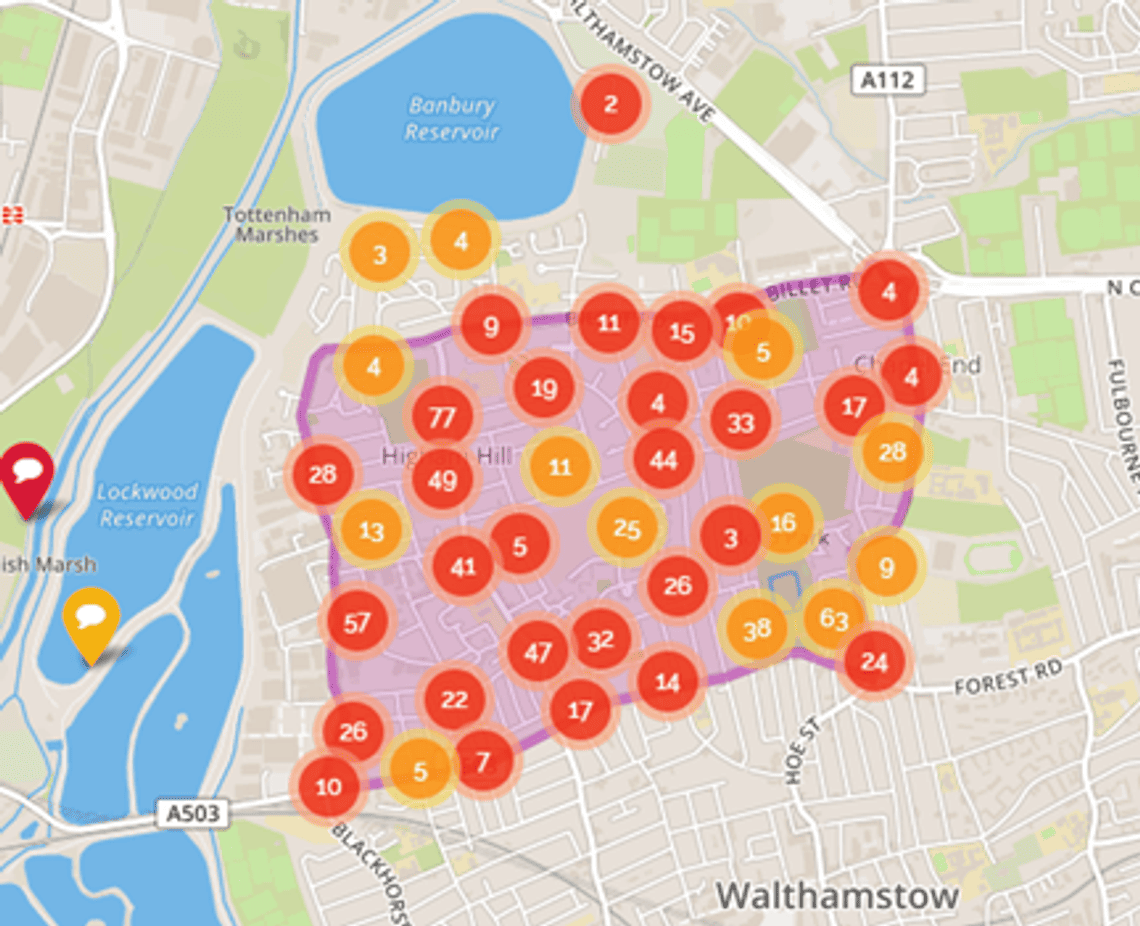
An online perception survey was open for comment between 14 October to 7 November 2019. The survey allowed respondents to comment on changes that they would like to see made in the Higham Hill and Lloyd Park area. In total there were 1,457 visitors to the perception survey, 567 respondents with 954 comments. Respondents were asked a series of demographic and travel behaviour questions, and were then invited to drop pins on an interactive map of the area, and tell us their views about the location they had selected.
The map below gives an overview of the locations respondents made a comment about.
Who responded
Of the 567 users that registered to leave comments on the survey, 438 provided information about their connection to the area:
- 356 (81%) of respondents were residents
- 44 (10%) of respondents travel through the area
- 12 (3%) visit for leisure
- 25 (6%) work in the area
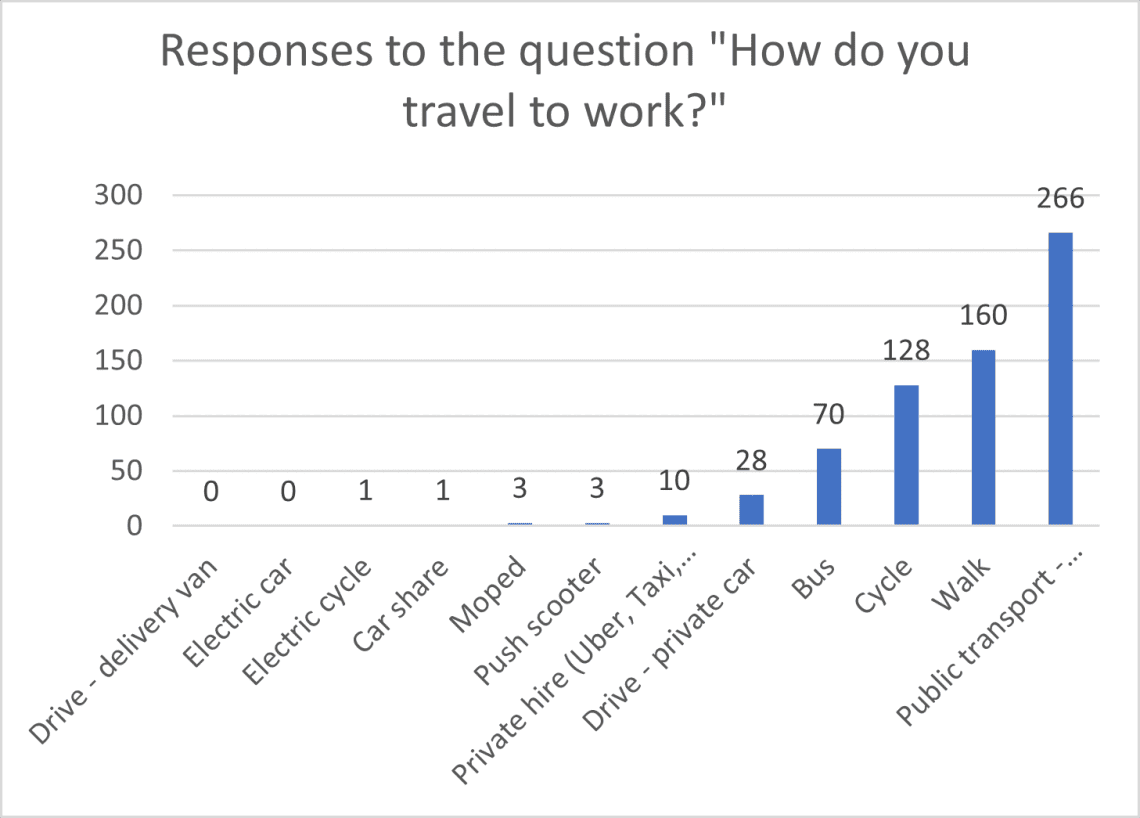
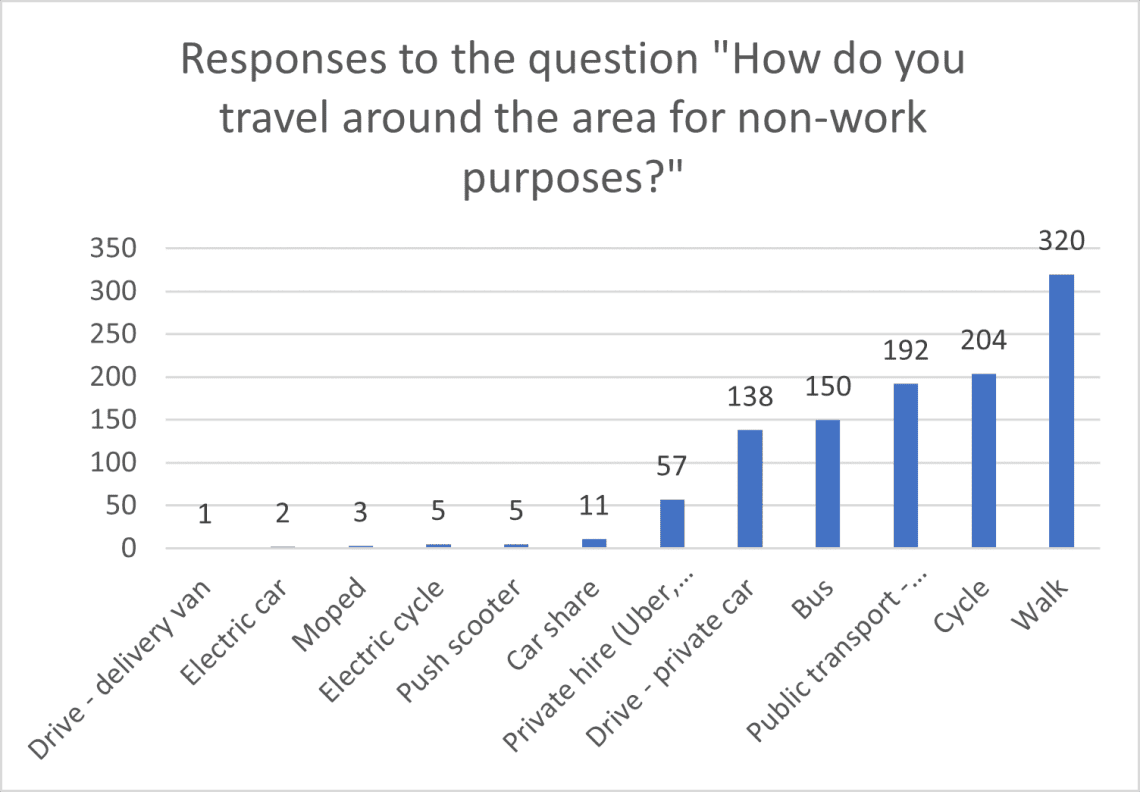
Respondents Travel Behaviour
We asked how respondents travel on their roads and in the surrounding areas for work and non-work purposes (respondents could select multiple options). The results are shown below.
Respondent’s feelings about the area
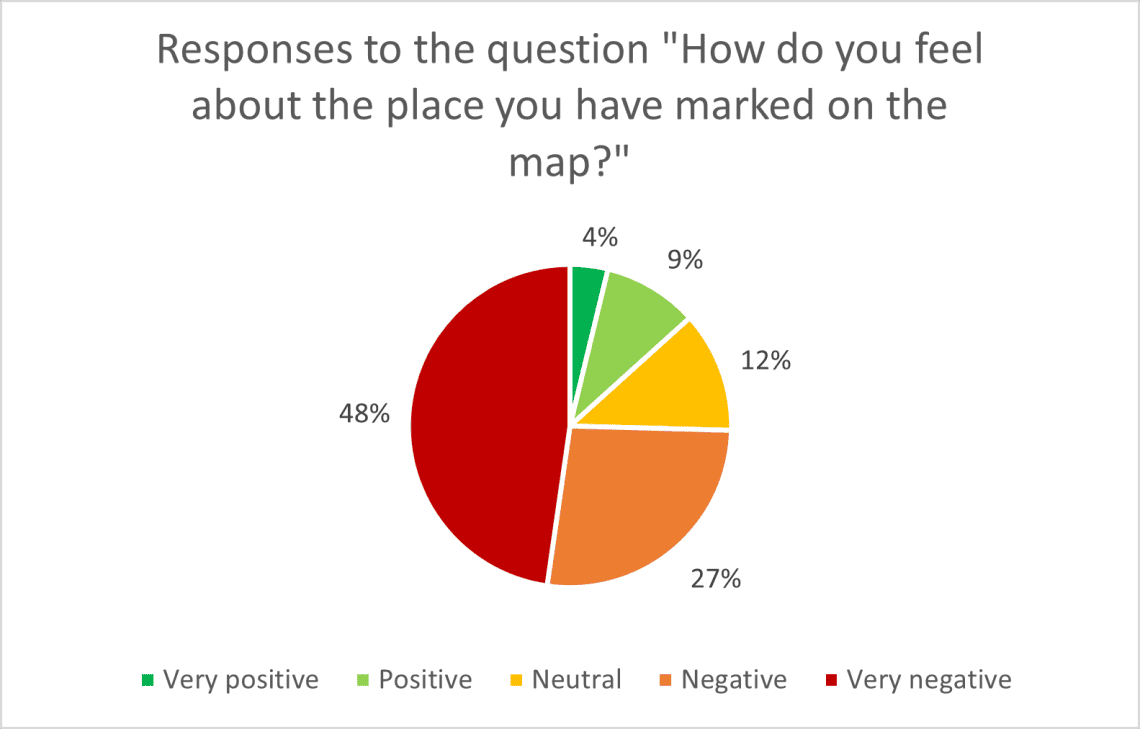
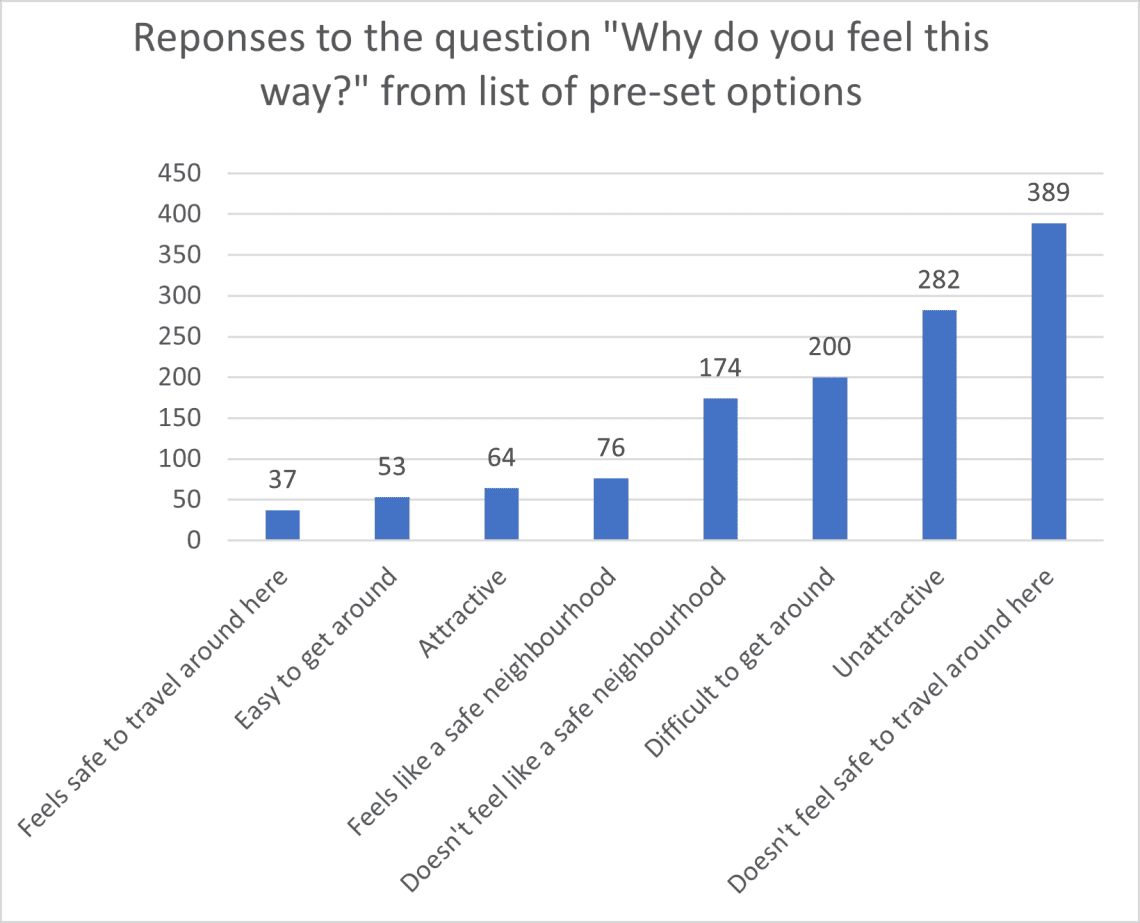
Respondents were asked to drop a pin on the map of the area and leave comments about the location they selected. This included providing a general sentiment (positive/negative) about the location and then a reason why they felt this way. Respondents could drop a pin on as many different locations as they wanted.
The majority of responses were negative towards the location they had selected and the most frequent three reasons they felt this way were:
- Doesn’t feel safe to travel around
- Unattractive
- Difficult to get around
The results are shown below.
Views on existing walking and cycling provision in the area
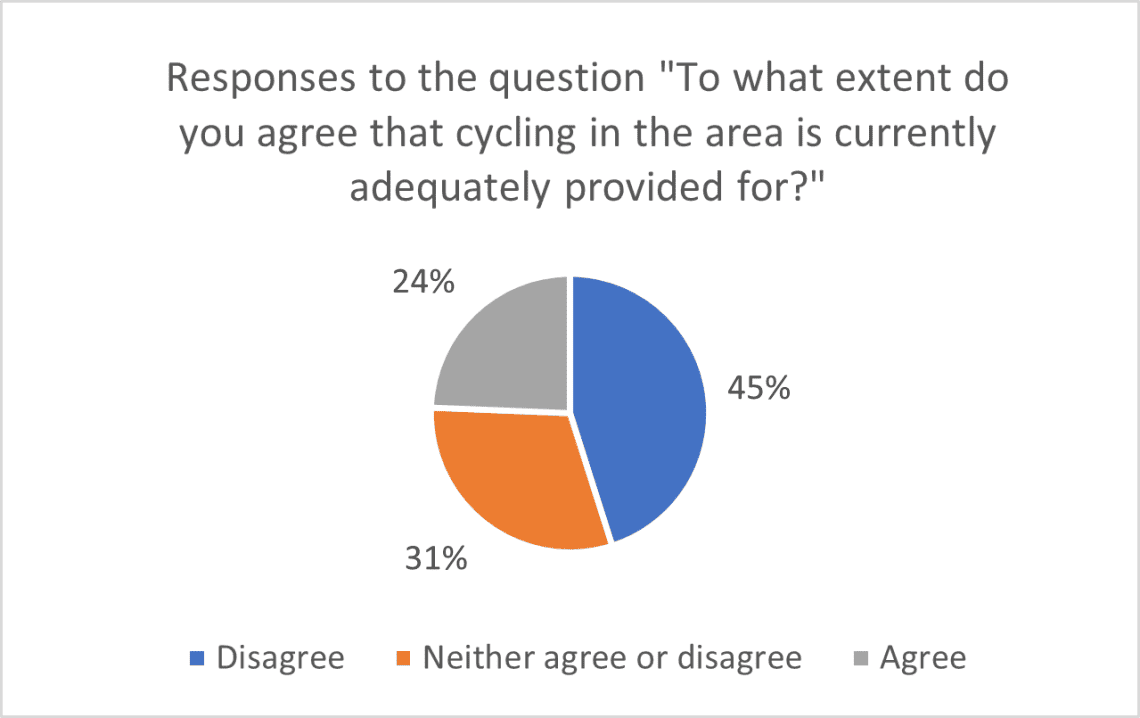
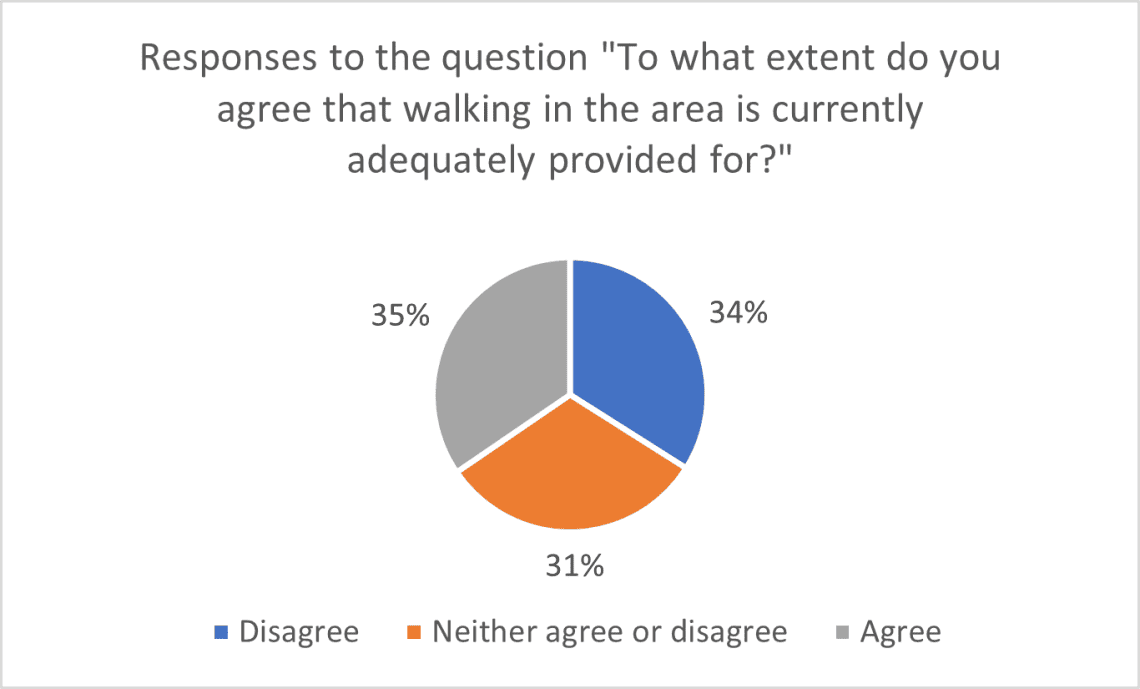
We asked how respondents felt about walking and cycling in the area, and how adequately they felt this was provided for. The results are shown below.
What would respondents like to see change
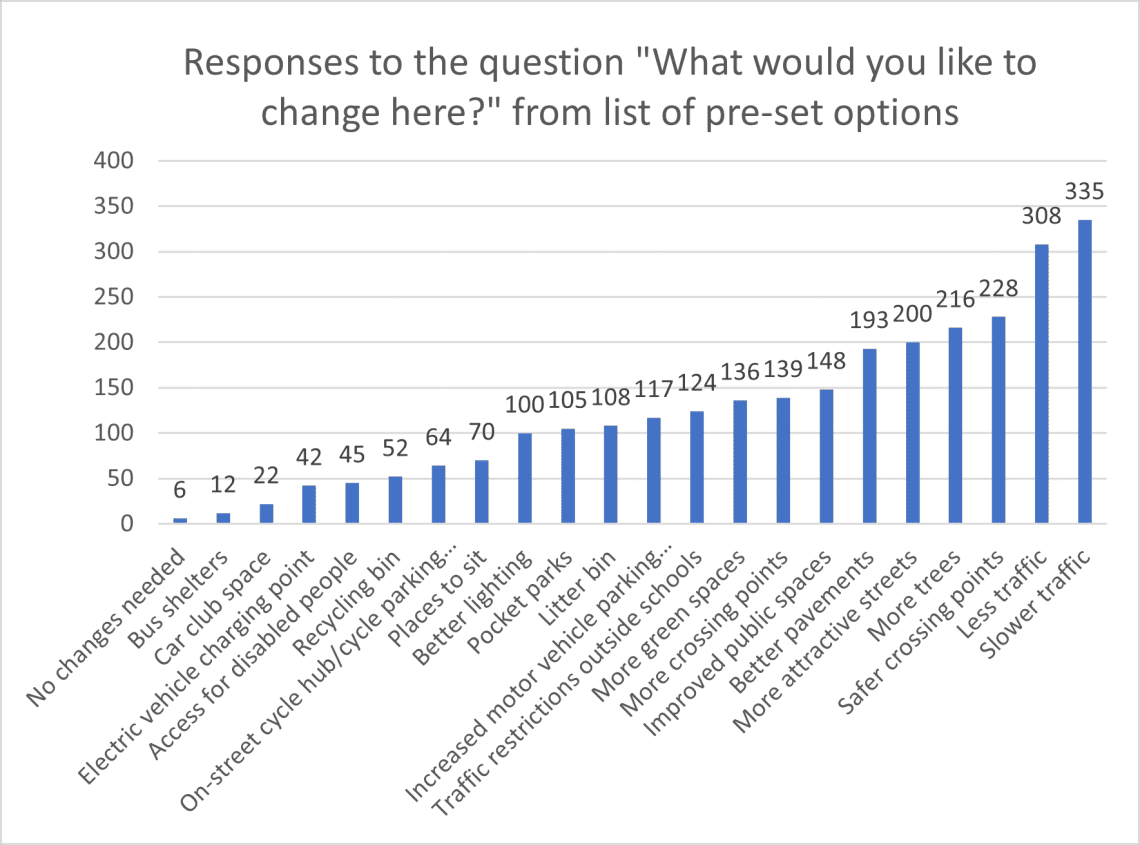
We asked respondents the things they would like to see change in the area. The most frequent three responses were:
- Slower traffic
- Less traffic
- More crossing points
The full results are shown below.
Stay Informed
Follow our projects to get notified of upcoming engagements and the latest project related news.